2023-05-26 00:00:00
4 min read
As a data analyst, you know the importance of having an efficient and effective business intelligence (BI) reporting process. A well-designed BI report can help you quickly derive critical insights and discover hidden patterns in your data. However, if set up improperly, these reports can cause confusion and even misguide their own end users.
In this blog post, we’ll discuss 5 ways to improve your BI reporting process to maximize the return on your reports.
1. Establish a Consistent Reporting Schedule
One of the first steps to improving your BI reporting process is to establish a consistent reporting schedule.
This means setting a regular schedule for when reports will be generated and distributed. This ensures that reporting doesn’t get put off and that data is always up-to-date.
A consistent reporting schedule also helps to establish a routine for data analysis.
This can help to identify trends and patterns in the data more easily. Additionally, it can help to ensure that all stakeholders receive the information they need in a timely manner.
2. Visualize but also Analyze with it
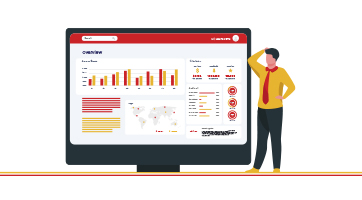
Data visualization is an important aspect of BI reporting. It involves presenting data in a visually appealing and easy-to-understand manner. This can include using charts, graphs, and other visual aids to help convey information.
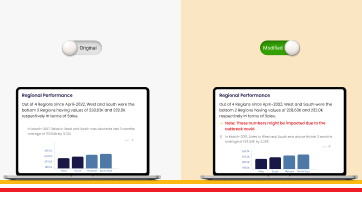
Effective data visualization can help to make complex data more accessible to a wider audience. It can also help to highlight key trends and patterns in the data.
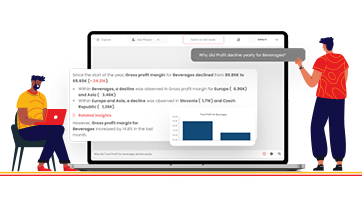
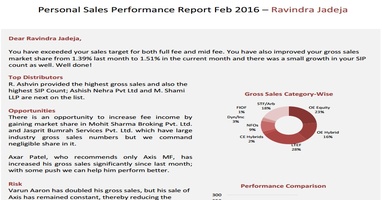
While Visuals do most of the work, it is important that the insights generated through the visual are precise and something on which business users can act upon.
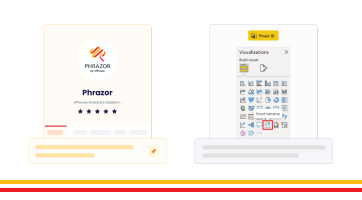
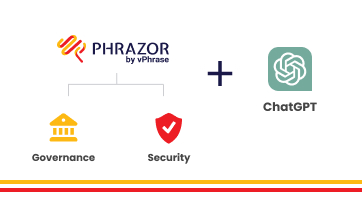
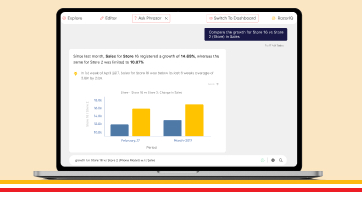
With Phrazor, business users can connect their data and get insights and analysis in natural language.
With this, business users can take action in real time by getting the insights they need in a readable format.
3. Automate Your Data Collection
Automating your data collection can help to improve your BI reporting process by reducing the amount of manual work involved.
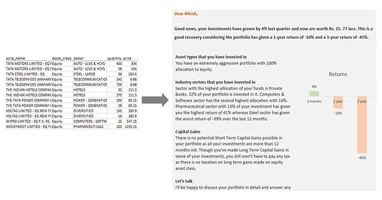
Imagine performing analysis to find a solution to a query and you need to open multiple excel files and refer to other sources.
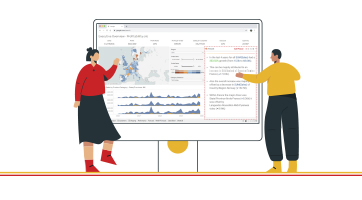
To solve this, analysts can now seamlessly connect all their datasets to Explorazor and utilize its "google-like" search functionality to swiftly uncover the desired insights.
By harmonizing all the Excels and datasets into a single comprehensive dataset, correlations across different datasets are established.
This eliminates the need for analysts to spend days sifting through multiple Excel files to find the insights they seek. With Explorazor, they can obtain those insights within seconds, revolutionizing their analytical process.
This can include using specialized reporting software to automatically bring data together from all sources.
By automating your data collection, you can ensure that your reports are always up-to-date with the latest information. Additionally, it can help to reduce the risk of errors and inconsistencies in the data.
4. Identify Reporting Requirements
Another way to improve your BI reporting process is to identify the reporting requirements of all stakeholders. This involves making an exhaustive list of all the decision makers and end users for your reports.
Once you have identified all the stakeholders, you can schedule interviews with them to gather their reporting requirements.
These interviews should include all executives, managers, and data analysts who will regularly look at your BI reports.
During these interviews, you should ask questions such as:
1. Which reports do you currently use?
2. Do you need or want any additional reports or information?
3. Why do you need this report?
4. Who will use this report?
5. What type of device will they use to access the report?
6. How frequently will they use this report?
By gathering this information, you can ensure that your BI reports meet the needs of all stakeholders.
5. Identify the KPIs and Metrics for Each BI Report
The final way to improve your BI reporting process is to identify the key performance indicators (KPIs) and metrics for each BI report. This involves creating a list of KPIs and metrics that you want to display on each report.
To identify these KPIs and metrics, you should schedule interviews with relevant stakeholders. During these interviews, you should ask questions such as:
1. Which metrics and KPIs do you currently monitor for your business processes?
2. Which reports do you use to track these metrics?
3. Do you have sample reports for reference?
4. What data would you like to add or remove from these reports?
By identifying the KPIs and metrics for each BI report, you can ensure that your reports provide valuable information to stakeholders.
In conclusion, improving your BI reporting process involves establishing a consistent reporting schedule, working on your data visualization, automating your data collection, identifying reporting requirements, and identifying the KPIs and metrics for each report. By following these steps, you can create more effective and efficient BI reports that provide valuable insights into your business.
About Phrazor
Phrazor empowers business users to effortlessly access their data and derive insights in language via no-code querying